Syntax for Text, Graph, Screen and Import definition files
Reports can be text, graph, screen, or used in import.
The definition files needs to be edited with MS.Notepad, or some other text editor - use report tab
Note: Probe for Windows v3 has an editor for RPT and IPT definitions. (GPT in progress)
Text reports (RPT)
Use
Reports can be output to paper or pdf; exported in .htm format for the web; or exported as comma-delimited csv files.
Reports to paper or pdf have different sections - report header, page header, group header, details, etc
Each line in the RPT file specifies an item, and in which section it will print. Only items in the detail (each site) section will be exported. An item can be...
- A label (eg print = Site Report)
- A text box with data (eg print = Top Paddock)
- A line
In addition, a column can be specified.
A column will be printed in 2 parts...
- The title as a label
- The data as a text box.
The column titles can be printed either...
- in the group header
- or once on each page, in the page header.
Ver 3 allows editing the report on tab: items
Web output is configured on tab: web
Gauge on tab: Gauges
Each item that is to be output has a specification line with format...
SectionCode~TypeCode~Source~Left~Top~Right~Bottom~Font~Size~Bold~Format~Align~Units~Colour
Ver 1 - the .rpt file needs to be edited using MS.Notepad (or similar)
Section Codes
Section codes specify in which section of the report the item is to be printed.
| Code | Section | Output |
|---|
| RH | Report header | once, at beginning of report |
| RF | Report footer | once, at end of report |
| PH | Page header | at top of each page |
| PF | Page footer | at bottom of each page |
| GH1 | Group header 1 | before a group break |
| GF2 | Group footer 2 | after a group break |
| D | Detail | for each site |
| Cn | Column | both detail section and column headers |
| CH | Column header | either at top of page or after group header |
Type Codes
Type codes specify the type of data that is to be output.
| TypeCode | Description |
|---|
| SECTIONHEIGHT | Height of section in cm |
| TEXT | Text box e.g. Source = NAME will print Top Paddock |
| LABEL |
Label displaying fixed text e.g. Site Report
but can include text variables...
eg Sites report for %OWNER1% will output the item set on .
Or include numeric formulas...
eg Gain this week %CRNTAMT-PREVAMT;AMT;1% will output: Gain = -3.6 mm
Note: separate the formula, format and units with ';'
|
| FORMULA |
Text box will display numeric data or formula
eg Source = FULL or COTTON.DWU*1.2
|
| INDIRECTFORMULA | Value of a formula
eg Source = LOWER will evaluate the LOWER formula
|
| LINE |
Draws a line from Left, Top to Right, Bottom
size = line width in points (0 = hairline)
|
| GAUGE |

|
| BUCKET |

|
| PROFILE |

|
Source or Formulas
The source specifies where the data is coming from.
It can be the name of a field in the database, or a formula.
See Formulas and Variables
Position
- All positions (left, right, top, bottom) are specified in cm.
- Horizontal positions (left, right) are relative to the left margin.
- Vertical positions (top, bottom) are relative to the top of the current section.
For example...
RIGHT=8 is a point 8 cm from the left margin. If the left margin = 2.5 cm, the item will print at 10.5 cm from left edge of paper.
TOP=1.2 is a point 1.2 cm below the top of the current section.
Size, units, format, font
If a font or font size is not specified, the report default font is used.
Units and format are only applicable for numeric formulas.
Line sizes are specified in points. (1 pt = 1/1440 inches; 0 = hairline, the thinnest line possible on the printer).
Colours
Colours can be specified by name (eg: RED), or in hex (same as web css)
| Name | RGB() | Hex (css) | Note |
|---|
| Black | 0,0,0 | #000000 | |
| White | 255,255,255 | #FFFFFF | |
| Red | 255,0,0 | #FF0000 | |
| Green | 0,255,0 | #00FF00 | |
| Blue | 0,0,255 | #0000FF | |
| Yellow | 255,255,0 | #FFFF00 | |
| Magenta | 255,0,255 | #FF00FF | |
| Cyan | 0,255,255 | #00FFFF | |
| PaleRed | 255,192,192 | #FF8080 | |
| PaleGreen | 192,255,192 | #80FF80 | |
| PaleBlue | 192,255,255 | #8080FF | |
| PaleYellow | 255,255,224 | #FFFFE0 | |
| Grey | 192,192,192 | #808080 | |
| Teal | 0,128,128 | #008080 | |
| HotPink | 255,105,180 | #FF69B4 | |
| Orange | 255,140,0 | #FFC800 | |
| Warning | 241,151,158 | #F1979E | |
| Help | 255,140,0 | #FF8C00 | |
| Farm | 0,128,128 | #008080 | Grower/Farm colour |
| Actual colours can be changed by user on ... |
| Wetting | 0,215,215 | #00D7D7 [*] | depth graph profile |
| Drying | 183,255,255 | #B7FFFF [*] | depth graph profile |
| Soil | 255,128,0 | #FF8000 | Gauges |
| Water | 96,96,255 | #6060FF | Gauges |
| LowWater | 255,64,64 | #FF4040 | Gauges |
| AboveFull | 192,255,255 | #A4FFFF [*] | Sentek-style shading |
| Ok | 192,255,192 | #C0FFC0 | Sentek-style shading |
| BelowStress | 255,192,192 | #FFC0C0 | Sentek-style shading |
| BelowPWP | 155,96,96 | #9b6060 | Shading |
| NegativeInRed | 255,0,0 | #FF0000 | warning colour |
#FF00FF |
hexadecimal (6 hex characters, preceded by a #)
same as CSS/HTML eg #808080 = light grey
see: Colour Picker
|
Examples of Report/Export Specifications
Note: v3 - These specification lines are saved when using
| Specification line in RPT file |
Result |
PH,SECTIONHEIGHT,1.3 |
- Height of page header = 1.3 cm
|
PH,LABEL,Sites Report for %OWNER1%,0,0,15.8,0.5, Arial, 16 , 1 ,,L, 0, RED |
- prints in the page header
- Sites Report for Lebombo Farms
- left aligned in a rectangle from 0 to 15.8cm, 0 to 0.5 cm high
- Font = Arial, 16 pt; bold; in red
|
PH,LABEL,Where: %WHERE%,11,0.7,16,1.2, Arial, 12 , 1 ,,R, 0 |
- prints in the page header
- Where: EPIAMT<10
- right aligned, in a space from 0 - 5 cm wide, 0 - 0.7 cm high.
- Font = Arial, 12 pt, bold
|
GH1,LINE,,0,1.2,16,1.2,, 2 , 0 ,,L, 0 |
- In the first group header.
- Draws a horizontal line from 0 to 16 cm, 1.2 cm below top of section.
|
GF1,FORMULA,COTTON.DWU,0,0,5,0.5,Arial,10,DWU,0,L,1 |
- prints in the first group footer
- 3.6 mm/day
- (the value today of DWU from the file COTTON.DWU)
- left aligned in a rectangle from 0 - 5cm, 0 - 0.5 cm high
- Font = Arial, 10 pt; DWU format; not bold; with units (mm/day)
|
CH,SECTIONHEIGHT,2 |
- Column header section to be 2 cm high.
|
CH,LINE,0,2,18,2,1 |
- In the column header section
- Draws a line at the bottom of the section, 18 cm wide, 1 pt thick
|
The column header section height should be specified - this section can also have lines drawn like any of the other sections.
Column Specifications
Each column to be output needs a column specification, with the type code Cn, with format...
ColNum,Source,Width,Format,Units,Align,Title,TypeCode 'comments
Each column will be printed in to two parts, the title going to a LABEL (in either the page header or group header) and the source to a FORMULA in the detail section.
The horizontal position of the items will be calculated based on the column width.
The actual output will be suppressed if width=0. This can be used to calculate intermediate results.
The character | will force a new line in a column title.
| Item | Notes |
|---|
| ColNum | Cn n = column number |
| Source | Any reserved word (variables) or formula. |
| Width | Width of output, in cm. |
| Format | see Format Codes |
| Align | Alignment. L= left; C = centred; R = right. |
| Units | 1 = display units (eg mm/day) 0= no units |
| Title | The title at the top of a column - use | for multiple lines. |
| TypeCode | Formula or IndirectFormula |
Examples of Column Specifications
| Line in RPT file | Printed Result |
|---|
C3,NAME,0.8,T,R,0,Site|Name |
       Site
       Name
-----------
Top Paddock
    Site 33
|
C4,PDWU,0.6,DWU,R,1,Probe|Dwu|%UDWU% |
       Probe
         Dwu
      mm/day
-------------
  2.3 mm/day
  1.1 mm/day
|
C5,EPIAMT*AREA*FACTOR4,0.8,VOL,R,1,Amount |
      Amount
------------
       12 Ml
EPIAMT - data field that contains the calculated amount or water required if scheduling is based on estimated daily water use
AREA - is the site area
10 - is to convert from area*depth to volume
FACTOR4 - is in the lookup table - will be specific for each valve.
The output will be in the volume units (VOL) as selected by the user with ProbeMenu/DisplayUnits.
|
Graph report definitions (GPT)
To customise graph reports use and edit the file GITEMS.TXT or a .GPT file.
| Prior to version 1.0.204... |
After version 1.0.204... |
Prwin v3 |
| Report names in file GNAMES.TXT. |
File GNAMES.TXT is not used |
File GNAMES.TXT is not used |
| All reports in the file GITEMS.TXT |
As well as GITEMS.TXT, any *.GPT files in C:\Prwin folder are also available |
All GPT files must be in the Prwin\reports\ folder |
| The report number is Item 1 in each line. |
Reports start with the command ReportTitle
Number and Order are not used |
same as Prwin1 |
Item 8 used for 'units'
Item 11 used for 'bold' |
Same as 1.0.204 |
Item 8 used for OPTIONS
Item 16 used for for GraphStyle.ID
|
Each line in the GPT file has the format...
| Number, |
, Order |
, Command |
, Source |
, Alias |
, Format |
, Align |
, Units (v1)
Options (v3)
|
, Orientation |
, Size |
, Bold (v1)
Colour (v3)
|
, Left |
, Top |
, Right |
, Bottom |
, StyleID
(optional) |
| 1 |
2 |
3 |
4 |
5 |
6 |
7 |
8 |
9 |
10 |
11 |
12 |
13 |
14 |
15 |
16 |
Notes:
- If a formula is used that contains commas (e.g. =IF(criteria,Value1,Value2)) , use '~' as the delimiter between items.
- Prwin3 assumes a line has been upgraded to v3 if item 8 (options) is more that 10 characters eg
GGGGGGGGGG
- v3 allows a graph style as item 16 for positioning lines, arrows etc
| Item | Notes | v 3 Notes |
|---|
| 1 | Number | Report number from GNAMES.TXT (not used) | |
| 2 | Order | Printing order (not used) | |
| 3 | Command | see Command Codes | |
| 4 | Source | Text, data field or formula | |
| 5 | Alias | various | |
| 6 | Format | d mm yyyy; 0.00; DWU - see Format Codes. | |
| 7 | Align | Left; Centre; Right; LeftWrap - see Align Codes | |
| 8 |
Units | 1=display units (e.g. mm/day); 0 = no units |
see Options
|
| 9 | Orientation | Position relative to point see Text Boxes and Labels | |
| 10 | Size | Relative size of font (100% = standard; 200 = big), or line width in points | |
| 11 | Bold | 1 = bold; 0 = normal | see Colour |
| 12 | Left | Left coordinate position | |
| 13 | Top | Top coordinate position | |
| 14 | Right | Right coordinate position | |
| 15 | Bottom | Bottom coordinate position | |
| 16 | StyleID | Graph style ID - to position items using style scale eg lines, arrows | optional |
Command Codes
Available commands...
| id | Command | Purpose | Source | Position Units |
| 1 |
ReportTitle | Begin a Report
eg 1,1,ReportTitle,DripBlock
|
Title |
|
| 9 |
GraphType |
Set the current graph type |
0 = Depth Graph | 1 = Time Graph |
|
| 10 |
GraphPosition |
Set current graph position
eg 1, 1, GraphPosition,,,,,,,,,10,10,50,45 'position graph
|
|
data |
| 11 |
GraphTickSize |
Set tick size |
size |
graph |
| 12 |
GraphLegendPosition |
Set current graph legend position |
|
paper |
| 13 |
GraphSymbolSize |
Set symbol size |
size |
graph |
| 14 |
GraphScale |
Set current graph scale
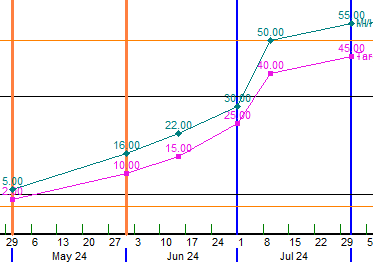
eg
1, 1, GraphScale,,,,,,,,,1/11/2004,450,CRNTDATE+10,0 'set time graph scale
1, 1, GraphScale,,,,,,,,,10,0,50,120 'set depth graph scale
|
|
data |
| 56 |
PlotGraph |
Plot current graph |
|
| 57 |
PlotAxes |
Plot just axes |
|
|
| 20 |
Text |
Plot text from a data field |
|
data |
| 21 |
Label |
Plot a label
may contain variables eg Ranch %FARMNAME%
|
|
data |
| 22 |
Formula |
Plot result of a numeric formula |
|
data |
| 25 |
IndirectFormula |
Outputs the evaluation of text that is a formula
eg 1, 1, IndirectFormula, LOWER,,,,,,,,90,10,95,12 'LOWER contains a formula for lower limit |
Field name |
data |
| 24 |
Picture |
Plot image. .BMP, .JPG or .WMF format |
file name
relative to App\Reports\
|
data |
| 30 |
Line |
Draw line from Left,Top - Right,Bottom
Source can (optionally) set the colour
Size can (optionally) set the line width in points
Keydata lines. Style ID after Y2
(also applies to box and arrows)
|
|
data |
| 31 |
Box |
Draw box from Left,Top - Right,Bottom |
|
data |
| 32 |
Arrow |
Draw arrow from Left,Top -> Right,Bottom |
|
data |
| 33 |
DoubleArrow |
Draw double arrow from Left,Top <-> Right,Bottom |
|
data |
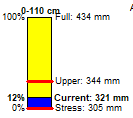
| 36 |
Gauge |
Fuel Gauge showing current RZ1 relative to Full (100%) and Refill|Stress|PWP (0%)
eg 1, 1, GAUGE, RZ1, RZTEXT1, AMT, 0,GGGGGGGGG,0,80,Black,60,20,62,35
Source: RZ1
Alias heading shown above gauge - RZ1TEXT -> 0-110cm
Font 80% of standard size
Positioned at horizontal = 60-62%, vertical = 20-35%
Colours, labels set with
|
 |
paper |
| 52 |
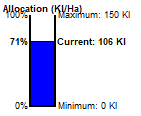
Bucket |
Plot Bucket showing water allocation usage during the season.
eg 1, 1, BUCKET, K5, Allocation (Kl/Ha),AMT,0,GGGGGGGGGG,0,80,0,70,20,72,35
Total water use calculated from meter readings entered in keydata row 1 (K1)
Formula @CUM(k2) in keydata row 5 (K5) calculates total delivered water during the season
Allocated amount (maximum allowed) entered in keydata row 5 FULL column.
Enter the first meter reading in Refill column to calculate volume used in season.
Top caption = Allocation (Kl/Ha)
Font 80% of standard size
Positioned at horizontal = 70-72%, vertical = 20-35%
Colours, labels set with
|
 |
|
| 41 |
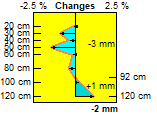
ProfileGauge |
A diagram showing the changes down the profile, in both VSW% and mm, between that last 2 readings.
Customised here , but gauge size set in .gpt line
eg 6, 1, ProfileGauge, , Changes, VSW, 0, GGGGGGGGGG,0,80,Black,85,20,95,40
|
 |
|
|
Formatting |
Various options are controlled by characters in the options string
eg Character(1) plots a border
Character(2) sets bold
- (1) Border
H = text
- (2) Bold
H = bold text
- (3) Units
H - units after values eg 3.2mm/day
- (4) Negative
H = output negative values in red: -23.0 mm
- (5) Fill Style
G=transparent, H=solid, I=horizontal, J=vertical
, K=diagonal up, L=diagonal down, M=cross, N=cross diagonal
- (6) Line Style
G=solid, H=dash, I=dot, J=dash-dot
, K=dash-dot-dot, L=transparent, M=inside?
|
| 60 |
Colour |
Set colour for all following items |
details |
|
| 61 |
BackColour |
Clear and set background colour
(but not for physical printer)
|
details |
|
| 62 |
DrawWidth |
Set width in points for all following lines |
Width |
Points |
| 63 |
DrawStyle |
Set line style for all following lines |
0 = solid
1 = dotted |
|
| 67 |
Font |
Name = Source; Size = Alias |
Font Name |
|
| 28 |
Include |
Include another graph report
e.g. 1, 1, Include, DripBlock output report with name = 'DripBlock' |
Report name |
|
| 16 |
GraphRows |
Set which rows to plot on time graph.
eg 1, 1, GraphRows, 2, RZ1 'plot field list RZ1
|
0 = All
1 = Selected
2 = Field list; Alias = Field list name |
|
| 17 |
GraphColumns |
Set which columns to plot on depth graph.
eg 1, 1, GraphColumns, 2, 3 'plot last 3 readings |
0 = All
1 = Selected
2 = Latest. Alias = NumberOfLatest |
|
| v3 Commands |
| 2 |
BeginIf |
Start of an IF block |
condition |
|
| 3 |
BeginElseIf |
Start of an ELSE IF block |
condition |
|
| 4 |
Else |
Start of an ELSE block |
|
|
| 5 |
EndIf |
End of an IF block |
|
|
|
example
1 ,1, BEGINIF, CROPNUM=20 'if site crop number = 20 do the following commands

1 ,1, BEGINIF, MethodID=2 'if site is 'continuous' do the following commands

1 ,1, BEGINIF, Option(49)  'if site is a 'text import' do the following commands

1 ,1 ,BEGINELSEIF, FARM = 4 'if farm number = 4 do the following commands

1 ,1 ,ELSE 'otherwise do the following commands
see option codes
|
| 6 |
Select |
Start of Select/Case block |
Variable name |
|
| 7 |
Case |
if any value is true then then following lines are output |
value(s)
eg 1,3 |
|
| 4 |
Else |
following lines are output if no output from other CASE |
|
|
| 8 |
EndSelect |
end of select block |
|
|
|
example
1,1,SELECT, CROPNUM

1,1,CASE, 1 'if crop number=1 do the following...

1~1~CASE~ 2,3 'if crop number=2 or 3 do the following...

1,1,ELSE  'for any other crop number do the following...

1,1,EndSelect
|
| 41 |
ProfileGauge |
Diagram showing changes in soil moisture down profile |
|
|
| 15 |
GraphOption |
Set any option. Alias = value of option
eg
1, 1 , GraphOption, 21, 1 'set option(21) = 1 = 'plot Refill profile on depth graphs'
See option codes |
Option |
|
| 29 |
RestoreSettings |
Restore all options to user settings |
|
|
| 35 |
NewPage |
Print a new page |
|
|
| 37 |
Orientation |
Set paper orientation
eg
1,1,Orientation,2 'switch to landscape
|
1 = Portrait; 2 = Landscape |
|
Labels, text and formulas
Text can be positioned in two different ways...
-
If Right, Bottom are entered then...
- Text is plotted inside a box given by Left, Top, Right, Bottom
- Align = Left | Right | Centre inside box see align codes
- If Orientiation = 1 a line is plotted around the box.
e.g.
3,3,LABEL,Full:,,,R,,1,100,1,88,10,92,12 |
prints 'Full:' right aligned in a box from 88-92% horizontal, 10-12% vertical. |
-
If Right, Bottom are not entered then...
- The text is positioned relative to a point
- Left and Top are the coordinates of the point
- Orientation sets position relative to the point.
- Align - not used
e.g.
3,3,LABEL,CRNTAMT,,AMT,1,0,-8,100,0,CRNTDATE,CRNTAMT,, |
The value of RZ1 is printed just above the last probe reading... |
Position Units
The position of a graph and the legend are in percent of paper (or screen)
- top left of paper is 0%, 0%; centre of paper is 50%, 50%; bottom right of paper is 100%, 100%
The position of all other items (text, labels, lines, arrows, scales) are in either...
(1) Percent paper units
| Left=50, Right=50 | exact centre of the screen or paper. |
or
(2) Data units
Can be specified as either a value or a formula.
If the first character is numeric (e.g. 50, or 10+(CRNTAMT+PREVAMT)/2) it is assumed to be percent % paper units.
(use +10+(CRNTAMT+PREVAMT)/2 instead)
If alpha or a formula (e.g. FULL+20 or +250 ) it is assumed to be in 'real-world' data units (e.g. mm of water).
The value is then converted to percent paper to position the item.
| Top = Full + 20 | Full point + 20 |
Text alignment
Text can be aligned inside a box
| Code | Result |
|---|
| Left | aligned with left side of box |
| Right | aligned with right side of box |
| Centre | centre aligned |
| LeftWrap |
as above, but with text wrapped
use '|' for New Line
use '@' for tab
|
| CentreWrap | |
| RightWrap | |
Text orientation
Text can be output relative to a point
| Code | Text position relative to point |
|---|
| Centre | centred on the point |
| AboveRight | above/right |
| Right | right |
| BelowRight | below/right |
| Below | below |
| BelowLeft | below/left |
| Left | left |
| AboveLeft | above/left |
| Above | above |
| AboveRightPlus | same as AboveRight,
but with extra half-character space |
| etc, etc | ...plus extra half-character space |
Text and formula options
Prwin2 saves extra options for text and formulas as characters. G = 0 (OFF); H = 1 (ON); I = 2, etc
e.g. GHHGGGGGG will show text without no border, in bold, and numeric values with units
| Character | Result |
|---|
| 1 | Plot border around object |
| 2 | Text in bold |
| 3 | Show units (e.g. mm) |
| 4 | Display in red if negative (actual colour can be changed) |
| 5-10 | Spare |
Numeric codes for graph options
Numeric codes used with command GraphOption to get (or over-ride) an option.
| Code | Time graph... |
|---|
| 1 | Plot Effective Rainfall |
| 2 | Plot Delivered Rainfall |
| 3 | Plot Effective Irrigations |
| 4 | Plot Delivered Irrigations |
| 5 | Plot Prediction using Probe DWU |
| 6 | Plot Prediction using Estimated DWU |
| 7 | Plot Prediction using site formula DWU |
| 8 | Plot Last Year |
| 9 | Plot Weather |
| 11 | Plot Prediction using ScheduleDWU |
| 13 | Plot Associated3 |
| 14 | Plot DWU calculated from site DWU formula |
| 15 | Plot Selected global formulas |
| 12 | TimeLocal
0 = Use Global settings
1 = use local, site-specific, settings for site |
| Code | Depth graph... |
|---|
| 19 | Plot Permanent wilting point profile |
| 20 | Plot Full point profile |
| 21 | Plot Refill point profile |
| 22 | Shade between Full-to-Refill profiles |
| 23 | Shade between latest profiles |
| 24 | Shade between Current-to-Full profiles |
| 25 | Shade between Current-to-Refill profiles |
| 26 | Shade between Current-to-Previous profiles |
| 27 | Plot Last year |
| 33 | DepthLocal
0 = use Global settings
1 = use local, site-specific, settings for site |
Other options...
| Code | Purpose | Values |
|---|
| 41 | GainsSavedIn | 0 = separate column
1 = keydata rows |
| 42 | DeliveredIrrigationRow | Keydata row for delivered irrigations |
| 43 | EffectiveIrrigationRow | Keydata row for effective irrigations |
| 44 | DeliveredRainRow | Keydata row for delivered rains |
| 45 | EffectiveRainRow | Keydata row for effective rains |
| 46 | PredictMode | 0 = existing date/amount system
1 = drip method (amount = DWU*DAYS) |
| 47 | CorrectForRZ1Change | Add any change in RZ1 from previous probe readings |
| 48 | CorrectForLimits | 0 = None
1 = stay inside limits
2 = track to average |
| 49 | AutoImportTextFile | Automatic import from text file and append new data. |
| v3 below |
|---|
| 50 | CorrectForKSoil | Correct DWU using Ksoil when predicting |
| 51 | ScheduleUserEnteredDate | User has changed the schedule date |
| 52 | ScheduleUserEnteredAmount | User has changed the schedule amount |
| 53 | ScheduleWith | 0 = ProbeDWU
1 = EstimatedDWU
2 = site Historical DWU formula |
| 54 | ScheduleLocal | Using local setting for CorrectForLimits, CorrectForRZ1Change, DripDays |
| 55 | CorrectPDWU | If scheduling with PDWU, and PDWU < 0 or > 10, use EDWU (or HDWU) |
| 56 | AutomaticPostGain | ???is this the same as Prwin1 ??? |
Examples of graph report definition lines
| Line | Result |
3,3,LABEL,Full:,,,1,0,-6,,0,88,10,, |
A label with 'Full:', positioned to the left of X=88%,Y=10% |
3,4,FORMULA,Full,,AMT,0,1,-2,,0,88,10,, |
Value of full point in amount (e.g. mm or ins) units, positioned to the right of X=88%,Y=10% |
3,3,ARROW,,,,,,,1,, CRNTDATE, CRNTAMT-20, CRNTDATE, CRNTAMT |
A vertical arrow pointing to the last probe reading... |
3,3,LINE,,,,,,,,,BUDBURST,TYMAX,BUDBURST,TYMIN |
A vertical line at date = BUDBURST (set as global formula) |
Ticks and symbols
The size of ticks and symbol are in units of percent of graph size.
Ticks=2 will give 'standard' ticks with a length of 2% of the size of the graph;
ticks=100 will give a grid across the graph.
Format codes are used to set the display format. The value displayed (e.g. mm or ins, and decimal places) will also depend on
| Code | Notes |
| DWU | Daily water use in mm/day |
| AMT | Amount of water in mm |
| VOL | Volume of water in Ml |
| AREA | Area in Ha |
| DEPTH | Depth of reading in cm |
| VSW | Volumetric soil moisture in % |
| EMITRATE | Delivery rate per emitter in l/hr |
| 0.0 | 1 decimal place |
| 0.000 | 3 decimal places |
Other Microsoft format codes (as used in Excel) can also be used.
Screen definitions (SPT)
Different screen layouts can be customised. Each layout is given a name, and can be chosen on .
To customise screen layouts...
- v3 Use
- v1 Use and edit the file
SCRITEMS.TXT or a .SPT file.
| Prior to version 1.0.204 |
After version 1.0.204 |
Version 3 |
- All screen layout items are in the file
SCRITEMS.TXT
- The layout number was the first item in the line.
- Layout names were in the file
SCREENS.TXT.
|
- The file
SCREENS.TXT is not used
- The layout number is not used
- Different layouts start with the command ReportTitle
- As well as
SCRITEMS.TXT, any *.SPT files in App folder (C:\Prwin) are also available
|
- Use to choose a layout.
- Use to configure.
- All
.SPT files must be in the reports\ folder.
|
Each column on the screen can have a value or a gauge
Values below zero can be highlighted in red, and values can also be edited
Gauge are configured on
Each line in the SPT file has the format...
LayoutNumber, Column, Type, Source, Width, Format, Align, Units, Title 'Comment
| Code | Notes |
|---|
| 1 | LayoutNumber | Same number as LayoutName in SCREENS.TXT. (not used after v1.0.204) |
| 2 | Column | Screen column number, starting at 1 |
| 3 | Type | Text, label, formula, indirectformula, checkbox, gauge, bucket, profile - see Type Codes |
| 4 | Source | Field name, or formula |
| 5 | Width | Width of column in characters |
| 6 | Format | Format code for numeric data |
| 7 | Align | Left | Right | Centre |
| 8 (v1) | Units | 1 = units (e.g. mm/day); 0 = no units |
| 8 (v3) | Options | see |
| 9 | Title | Title at top of column.
Separate lines with '|'.
Can also include variables e.g. %UAMT% will display mm/day
|
| Comment | Help text that will be displayed if user right clicks on column title |
Examples of screen column definitions...
| Line | Result on screen |
2,0,ReportTitle,PR41Sites |
start of a new layout called PR41Sites |
2,1,Text,SITE,6,0,0,0,Site|Num 'Site number entered into Hydroprobe
|
In column 1...
   |Site   |
   |Num    |
   |       |
   |    123|
   |    124|
|
1,5,Formula,REFILL,7,AMT,R,0,Refill|%UAMT% 'Water holding capacity at which the plant shows stress |
In column 5...
   |Refill  |
   |      mm|
   |        |
   |     230|
   |     242|
|
1,6,Formula,FULL-CRNTAMT,8,AMT,R,1,Deficit|%UAMT% 'amount required to be applied to bring back to full point |
In column 6...
   |Deficit   |
   |        mm|
   |          |
   |     230mm|
   |     242mm|
|
Import definitions (IPT)
The lines at the top of the file are set by various options on
These options allow the data to be filtered, only importing a reading every 6 hours, for example
If the data is from continuous logging systems, an irrigation can be automatically posted if there is an increase in soil moisture
There are two types of lines...
Note: ver2 has a different format, but it also has an IPT editor.
Imported columns
The line has the format...
Cn, Format, Start, Width, Row 'Comment
| Code | Notes |
|---|
| 1 | Cn | Column number e.g. C4 |
| 2 | Format | G - any numeric
DT - date and/or time
T - text |
| 3 | Start | Start of data in characters - not required for delimited data files |
| 4 | Width | Number of characters - not required for delimited data files |
| 5 | Row | Normally 1, but some loggers output data over more than 1 line |
| Comment | any text as a comment or reminder after a ' is ignored. |
Examples of column definitions...
| Line | Notes |
C1, DT, 0, 0, 1 'date+time | Date and time information in column 1 |
C2, G, 0, 0, 1 'rain | General data in column 2 (rain in this case) |
C3, G, 12, 23 , 1 | General data, from character positions 12 to 23 incl, in line 1 |
Destination of imported data
The line has the format...
On,Source,Destination,Calculated 'Comment
| Code | Notes |
|---|
| 1 | On | Output number e.g. O3 |
| 2 | Source | Column number (e.g. C3) or a formula |
| 3 | Destination | TYPE | DATE | R1-R16 | SN | K1-K16 - see examples |
| 4 | Calculated | 0 = calculated, 1 = just a column |
| Comment | any text after a ' is ignored - can be used for comments or reminders. |
Examples...
| Line | Notes |
|---|
O1~1~TYPE~ 0 'probe | 1 (code for Probe) put in TYPE |
O2~C1~DATE~ 0 'date | Date/Time from column 1 put in DATE |
O3~C8~R1~ 0 '20cm | Value in column 8 put in Reading 1 (probably 20cm reading) |
O4~C12~R2~ 0 '30cm | Value in column 12 put in Reading 2 (probably 30cm reading) |
O14~C15~K4~ 0 '50 cm temperature | Value in column 15 put in Keydata 4 (temperature ?) |
O21~C13~K11~ 0 '40 cm salinity | Value in column 12 put in Keydata 11 (salinity) |